The System
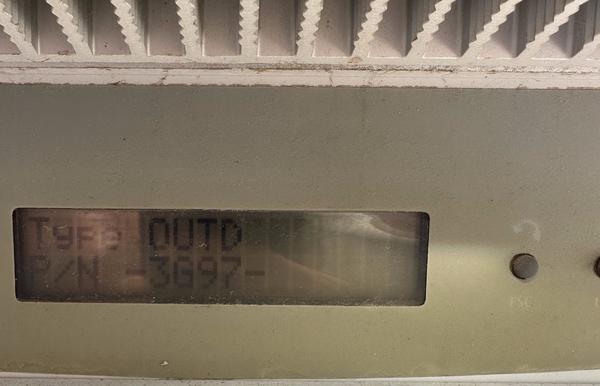
My solar array was installed by Sunrun in November 2011 at my property in Westlake Village, California. It sits on a concrete tile roof and feeds a 20-year lease that was originated by a previous homeowner and transferred to me with the purchase of the property. Under its terms, I purchase every kilowatt-hour the system generates at a rate that escalates 2.9% annually. Below is a photograph of the inverter as it is mounted on the exterior of my home, along with the specifications I have gathered from the inverter's own diagnostic display and from the original contract documents.
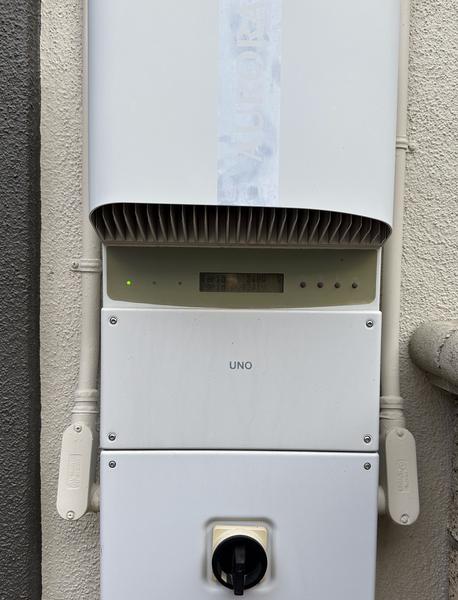
| Inverter | Power-One Aurora UNO |
| Type | OUTD (Outdoor, transformerless) |
| Part Number | -3697- |
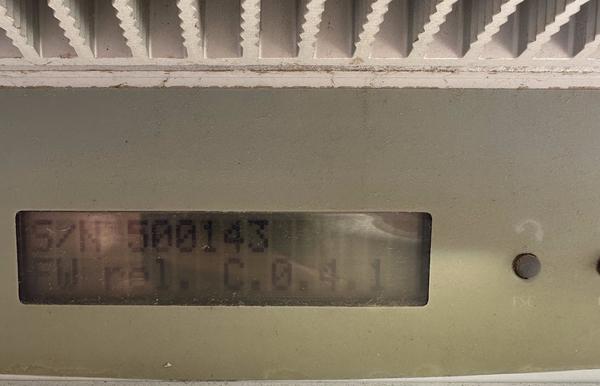
| Serial Number | 500143… |
| Firmware | C.0.9.1 |
| MPPT Inputs | 2 (independent tracking) |
| Installation Date | November 2011 |
| Lease Term | 20 years (expires ~2031) |
| Panels Installed | 17 |
| Estimated Panel Rating | ~250W each |
| System Capacity (DC) | ~4.25 kW |
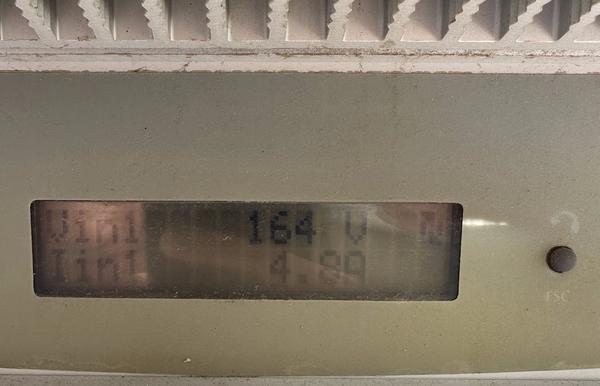
| String 1 | 6 panels • 164V / 4.8A |
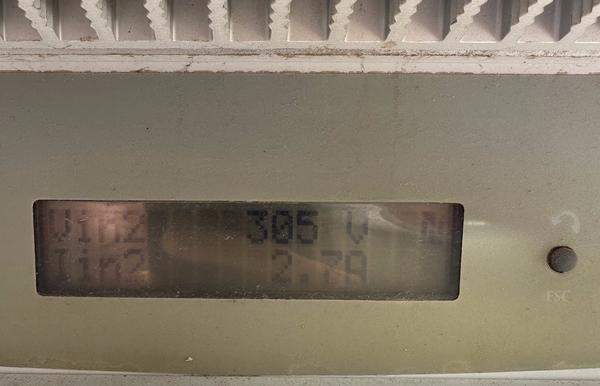
| String 2 | 11 panels • 305V / 2.7A |
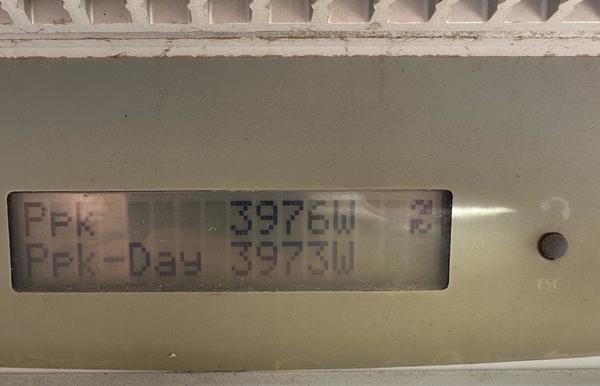
| Peak AC Output (all-time) | 3,976W |
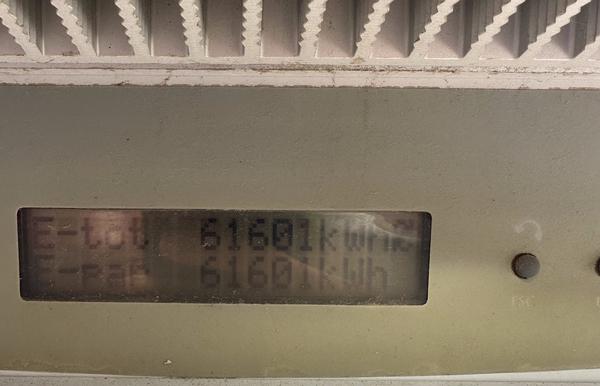
| Lifetime Energy | 61,601 kWh |
| Starting Rate (Year 1) | $0.260 / kWh |
| Annual Escalator | 2.9% |
| Current Rate (Year 15) | ~$0.388 / kWh |
| Billing Model | Balanced (fixed monthly) |
| Upfront Payment | $1,000 |
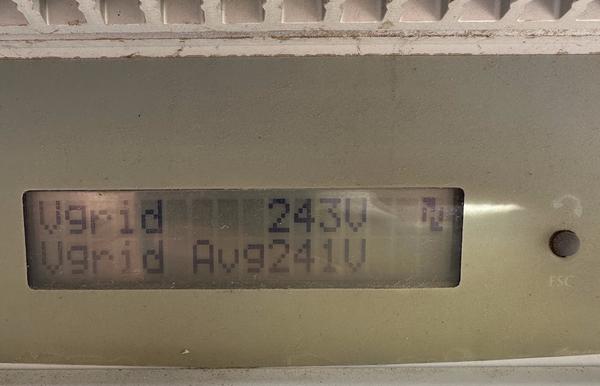
| Grid Voltage (measured) | 243V / avg 241V |
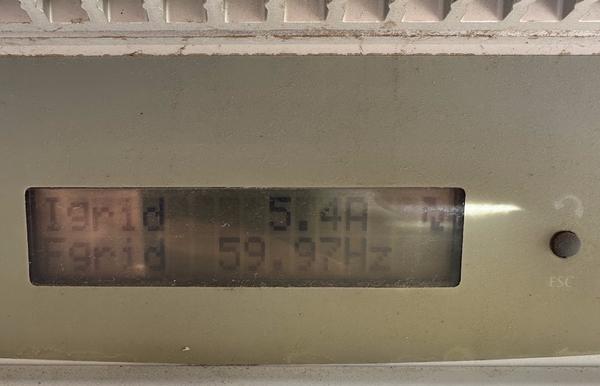
| Grid Frequency | 59.97 Hz |
Under balanced billing, I pay the same estimated amount every month regardless of actual production. If the system produces less due to a ground fault shutoff, the payment stays the same. This is why system reliability matters so much — every fault event costs me money I have already been billed for, and I am still purchasing replacement electricity from Southern California Edison at the same time.
Two States of the Same Inverter
The Aurora UNO's front panel tells the entire story at a glance. A green LED means the inverter is running and producing power. A red LED means a fault has been detected and the system has shut itself down. Over the past two years, my inverter has toggled between these two states 237 times.
What the Inverter Reports
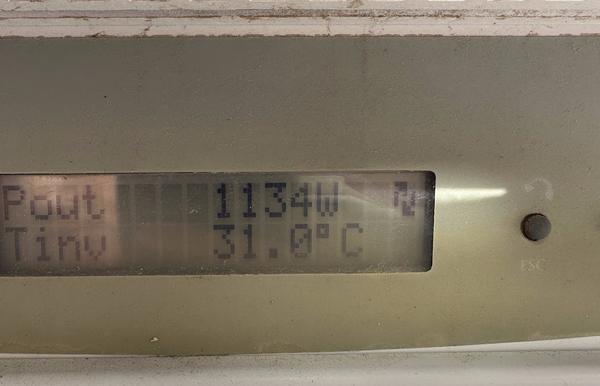
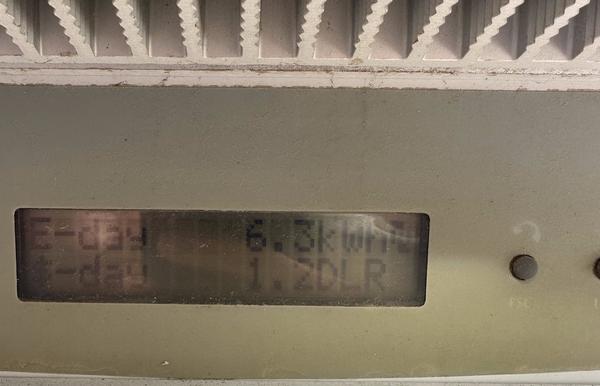
I photographed every screen of the inverter's cycling LCD display. These readings were captured on April 1, 2026, during normal daytime operation. Each screen auto-advances every few seconds, giving a complete diagnostic snapshot of the system.
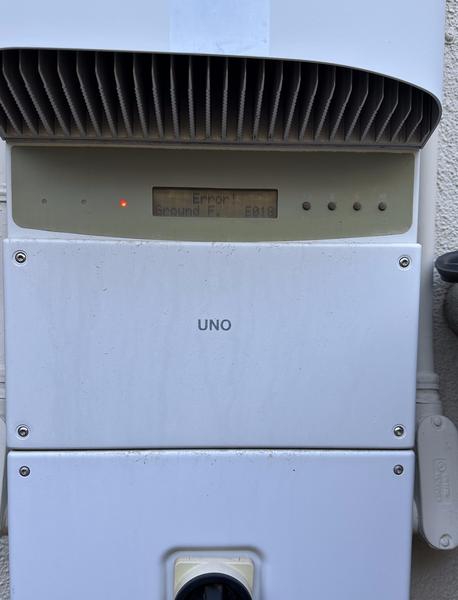
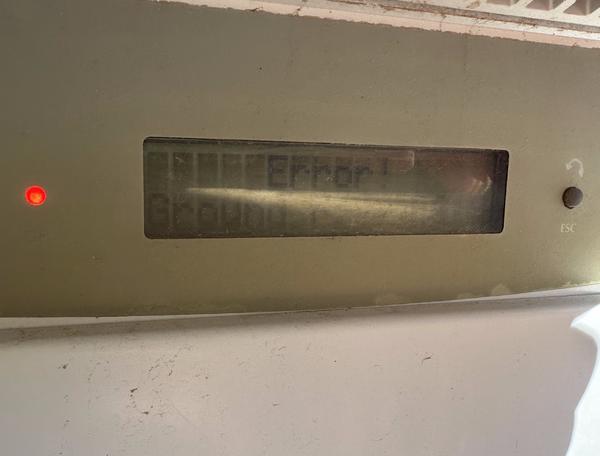
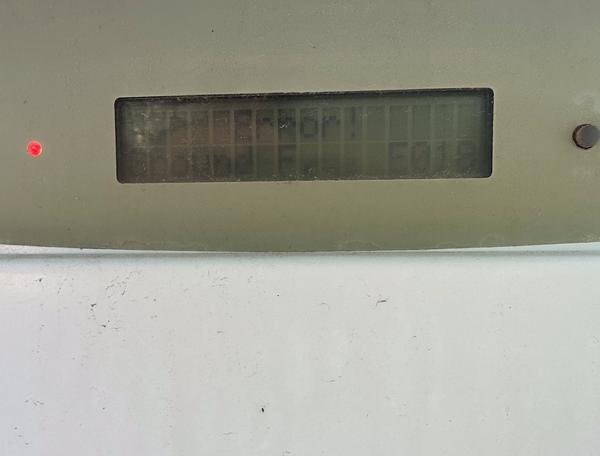
The Error Screen
When a ground fault is detected, the LCD switches from the normal cycling display to a persistent error readout. Below are two photographs of the LCD in this state — note the red LED and the "Error" / "Ground" text on the display. These were captured on a previous fault day. On the day I photographed the full LCD cycle (April 1, 2026), the system had in fact faulted earlier that morning — on an overcast day, which is significant — but while pressing the inverter's front-panel buttons trying to locate the model number, I inadvertently triggered the ESC reset sequence. The inverter rebooted and resumed production, clearing the error screen before I could photograph it in the faulted state. The fact that a ground fault occurred on a cloudy day with lower-than-normal DC voltage is itself diagnostic, and I discuss what that means for the insulation condition below.
23 Panels Planned, 17 Installed
The original system design called for 23 solar panels. During installation, the crew made a field decision to install 17 higher-wattage panels instead, achieving approximately the same total DC capacity with fewer units. On its face, this is a reasonable engineering substitution — fewer panels means fewer roof penetrations and a simpler wiring layout, while the total system output remains comparable.
~4,255W DC total
~4,250W DC total
The problem is not the substitution itself. The problem is what happened — or rather, what did not happen — afterward.
Sunrun's own mobile app, the My Sunrun app, still reports this system as having 23 panels. That is the number their customer-facing database returns. It is also the number visible on the monitoring dashboard. Fifteen years after installation, the records were never updated to reflect the actual hardware on my roof.
This matters because the same database that reports the wrong panel count is the database that is supposed to trigger alerts when the system faults. If the basic hardware inventory is wrong, it raises a question about what else in their monitoring and alerting pipeline has never been verified. Six panels exist only in a database. 237 ground fault events exist only in a log file no one reads. The pattern is consistent: the system of record and the physical system diverged on day one and no one has reconciled them since.
What the Diagnostics Reveal
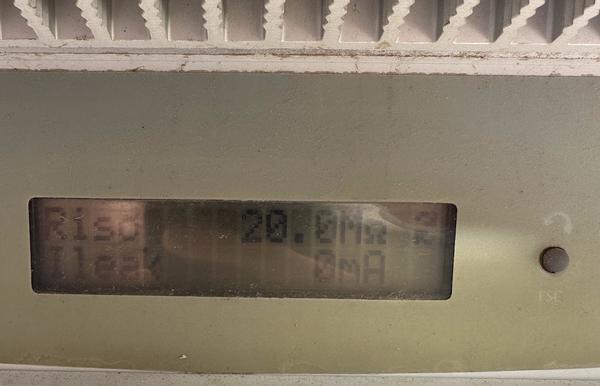
The Aurora UNO continuously monitors its own DC-side insulation through two key readings: Riso (isolation resistance between the DC conductors and earth ground) and Ileak (leakage current to ground). These are displayed on the LCD in real time. During normal operation, Riso should be high — above 1 MΩ at minimum — and Ileak should be near zero.
At the moment I captured these readings, Riso measured 20.0 MΩ and Ileak read 0 mA. Both values look healthy. But this snapshot was taken after the inverter had already faulted and been inadvertently rebooted earlier that day. The readings reflect the system's state after the insulation condition temporarily recovered — not its state at the moment of the fault.
As a transformerless (non-isolated) inverter, the Aurora UNO is required under IEC 62109-2 to perform continuous residual current monitoring during operation. The standard mandates a fast-trip threshold of 30 mA for sudden residual current changes (personnel protection) and a 300 mA threshold for slowly rising leakage current (fire safety). [1] The inverter also performs a pre-startup Riso check each morning: if the insulation resistance is below approximately 1 MΩ, the inverter will refuse to connect to the grid at all.
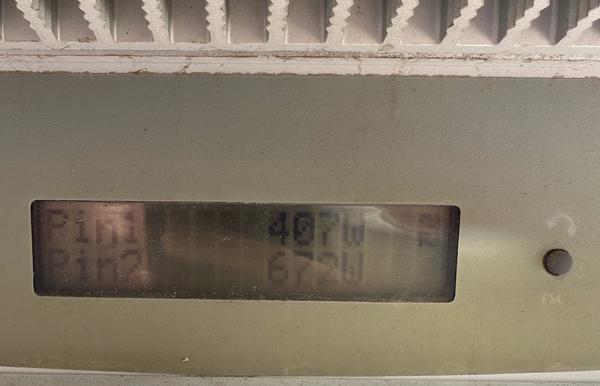
The inverter also reports the power contribution from each string independently. String 1 (6 panels) produced 407W and String 2 (11 panels) produced 672W at the time of these readings. The per-panel output is roughly 68W and 61W respectively — well below the ~250W nameplate rating, consistent with the overcast conditions. What matters is that both strings are producing, confirming the system is physically intact between fault events. The inverter has the data. The telemetry channel is connected. The information exists. It is simply not being acted on.
This pattern — healthy readings between faults, repeated shutdowns during daylight hours, 237 events over two years — is the textbook signature of intermittent insulation degradation. A connection that loosens under thermal expansion during peak production, or moisture that infiltrates a compromised junction and evaporates overnight. The fault clears itself each evening and returns the next day. Every one of these events is logged. Every one is transmitted through the telemetry channel that Sunrun monitors. And every one, until I called customer service in February 2026, went unanswered.
How the Data Leaves This Inverter
Understanding what Sunrun could have known — and when — requires understanding how this inverter communicates with the outside world. The Aurora UNO was designed with multiple data pathways, and what I can observe about my installation raises questions about how much diagnostic capability has gone unused.
The RS-485 Diagnostic Port
The Aurora UNO series includes an RS-485 serial communication port — an industrial-grade diagnostic interface located inside the inverter's wiring compartment. RS-485 is the same standard used in factory automation and commercial energy systems. It is designed for technicians, not consumers.
According to the manufacturer's documentation, a technician equipped with a standard USB-to-RS-485 adapter — available for under $15 — and the manufacturer's free diagnostic software (Power-One's "Aurora Communicator" for Windows) can connect directly to the inverter's internal memory. This provides access to data far more granular than anything visible through remote monitoring: exact-to-the-second fault timestamps, voltage conditions at the moment of each trip, temperature logs, and a complete history of error codes.
I do not know whether Sunrun has ever connected anything to this port on my unit, or whether their standard monitoring setup makes use of it. What I do know is that this capability exists in the hardware and is documented in the service manual. At any point after my February 25, 2026 customer service call — when Sunrun was made aware of recurring ground faults — a technician could have been dispatched with commodity hardware to download the complete diagnostic record directly from the inverter. This is the standard troubleshooting procedure the manufacturer describes for exactly this type of recurring fault.
The Revenue-Grade Meter
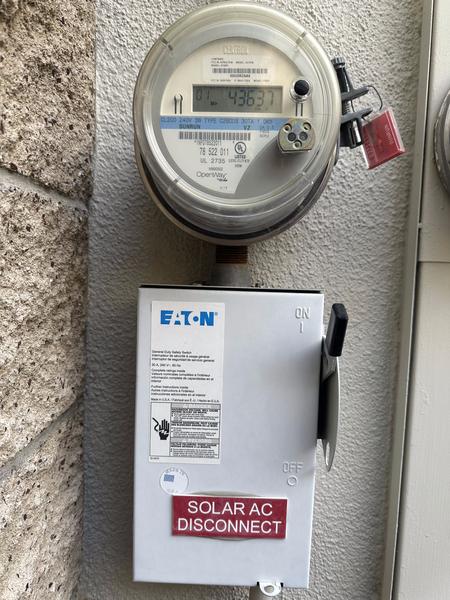
Revenue-grade meter and Solar AC Disconnect — mounted since 2011
What I can confirm is the separate physical meter Sunrun installed alongside the system. It has been mounted on the exterior of my home since the original 2011 installation — the conduit and weathering are consistent with 15 years of exposure. This is a revenue-grade meter (RGM): its job is to measure every watt of solar electricity the inverter produces before my house consumes it. Because my lease bills me for power generated, this meter is the basis for Sunrun's invoices to me. It is also the instrument that earns Sunrun their renewable energy credits.
The meter communicates with Sunrun's servers through a built-in cellular modem. It operates independently of the inverter — it measures power output at the electrical level, not by querying the inverter's software. This is the primary telemetry channel through which Sunrun tracks my system's production.
The Shift to 15-Minute Data
One observable fact about my production data is worth noting: prior to approximately 2019, my account shows only daily production totals. Starting around 2019, the data shifts to 15-minute interval reporting — a dramatically higher resolution that makes individual fault events visible as sharp midday dropoffs in the production curve.
The timing is suggestive. Around 2019, the major U.S. cellular carriers began decommissioning their 2G and 3G networks to free spectrum for 4G LTE and 5G. This created a well-documented industry-wide problem: millions of IoT devices — including solar monitoring equipment — relied on those older networks and needed hardware or firmware upgrades to maintain connectivity. Sunrun, which operates one of the largest residential solar fleets in the country, would have been directly affected.
Whether Sunrun upgraded my meter's cellular modem, pushed a firmware update to change the reporting interval, or made changes on the backend software side, I cannot say with certainty. What I can say is that the result is clear: from 2019 forward, Sunrun's servers have been receiving production data from my system at 15-minute granularity. Every one of the 237 ground fault events that began in February 2024 falls within this higher-resolution monitoring window.
Diagnostic Capability vs. Diagnostic Action
To summarize what the hardware makes available: the Aurora UNO has a built-in diagnostic port that any qualified technician can use to download the inverter's complete internal history with a laptop and an inexpensive adapter. Separately, Sunrun's own metering infrastructure has been delivering production data to their servers at 15-minute intervals throughout the entire period of recurring faults. One channel requires a site visit. The other delivers data automatically without anyone needing to leave their desk. Neither channel resulted in Sunrun contacting me, dispatching a technician, or taking any action whatsoever — until I called them.
The Fire Safety Placard
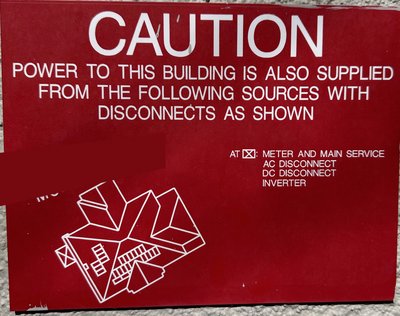
Fire safety placard showing the original 23-panel roof layout and disconnect locations
Mounted near the main electrical panel is a red fire safety placard — required by electrical code so that first responders know a photovoltaic system is present, where the panels are located on the roof, and where to find the disconnects. The placard on my home shows the original 23-panel layout: the full design as it was drawn before six panels were removed during installation.
Sunrun never updated this placard to reflect the actual 17-panel configuration. The diagram still shows panels in locations where none were ever installed. This is consistent with the broader pattern: the original 23-panel design lives on in every system of record — the placard on the wall, the monitoring app, the production database — while the physical roof has only ever had 17 panels.
The placard also identifies the disconnect locations: meter and main service, AC disconnect, DC disconnect, and inverter. These are the points where a firefighter or other first responder would isolate the system in an emergency. But there is an important limitation that the placard does not convey: opening the DC disconnect does not eliminate the shock hazard from the panels themselves. Photovoltaic modules generate electricity whenever light strikes them. There is no switch on the roof that turns them off. The DC disconnect isolates the inverter from the panel strings, but the conductors between the panels and the disconnect remain energized at DC voltages that can exceed 300 volts during daylight hours.
This is exactly why ground fault protection matters for anyone working on or near the roof — firefighters, roofers, or maintenance crews. A ground fault in the DC wiring means current is flowing through an unintended path, potentially through metal roofing components, wet surfaces, or a person. The inverter's 30 mA fast-trip threshold exists specifically to protect against this scenario. But when the inverter has shut down due to a fault, the panels are still energized and the fault condition that triggered the shutdown may still be present in the wiring. The disconnect switch changes nothing about that hazard.
[1] Residual current detection thresholds for transformerless PV inverters: IEC 62109-2:2011, Safety of power converters for use in photovoltaic power systems — Part 2: Particular requirements for inverters. Section 13.9 requires continuous residual current monitoring with a 30 mA fast-trip threshold for sudden changes (personnel protection) and a 300 mA threshold for slowly rising leakage (fire safety). webstore.iec.ch